 |
| CLICK ME! CLICK ME! |
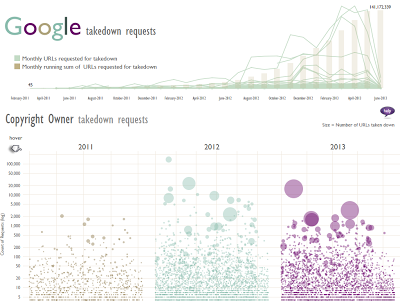
I've entered this viz in the Visualizing Online Takedown Contest at Visualizing.org. You should check out the submissions, there's some truly inspiring work there.
As you can imagine, this was a large chunk of data (600k+ rows) for Tableau Public, which restricts rows to 100k. Being used to using massive amounts of data in Tableau Professional, I of course forgot about this restriction until I went to publish it to the web on the morning of the contest submission.
In order to publish it I had to aggregate the data to month from day/minute. Unfortunately, I had presented the data at the week level, which is not an option for extract aggregation, so I also had to change some of -the views. Note to self: add this to the Ideas on Tableau Community.
To do this:
1
Look at your data first. The aggregation will roll-up your measures based on unique dimensions, so if you have a unique id field for every row, that won't be rolling up. With this data, I replaced the Request ID field with the value of 1, that way it summed up to the number of requests for a Copyright owner for the month. You should also note if there are pre-calculated metric values (rates, percentages), as you don't want those to aggregate.

2
Right click on the data source and select Extract Data
3
Select the appropriate aggregation level and Extract

Voila! Tableau brilliantly reduced the records from 600k+ to 40k. Sweet feature! Have I mentioned lately how much I love this program?
I should also mention that the bubbles view is built using the index() function. For more info on how to do this, check out Steve Wexler's blog post: